
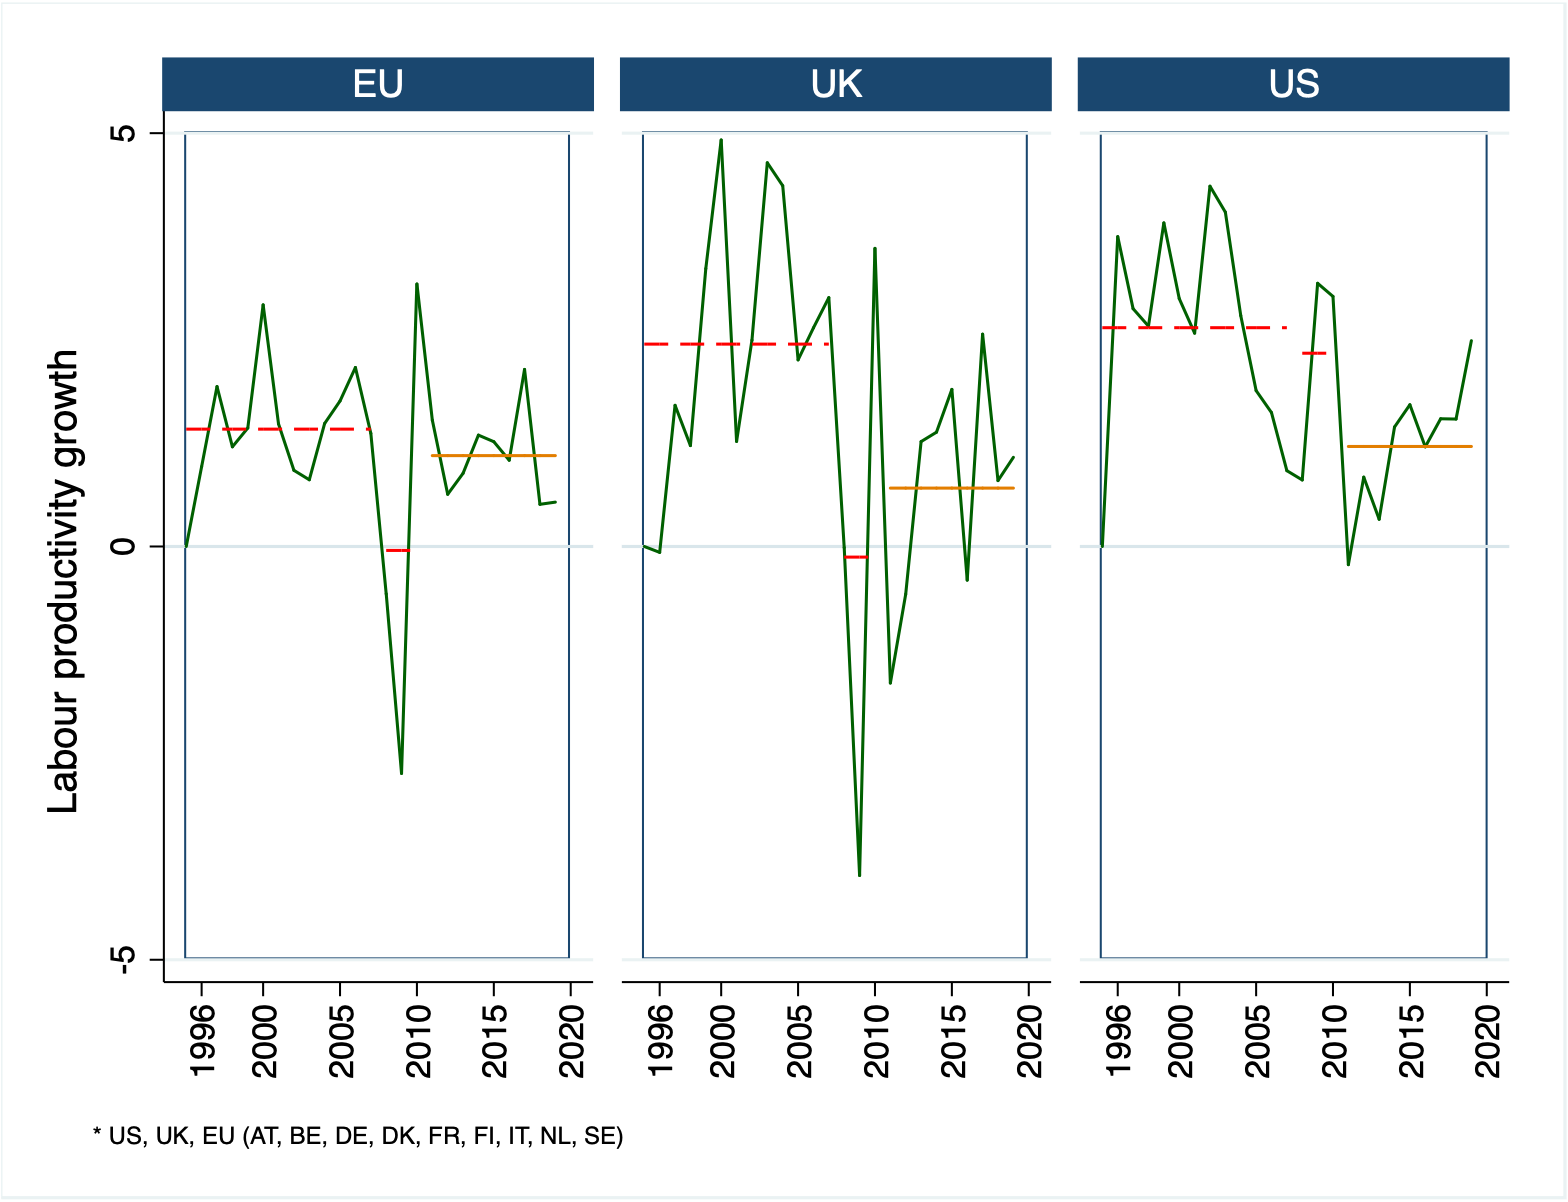
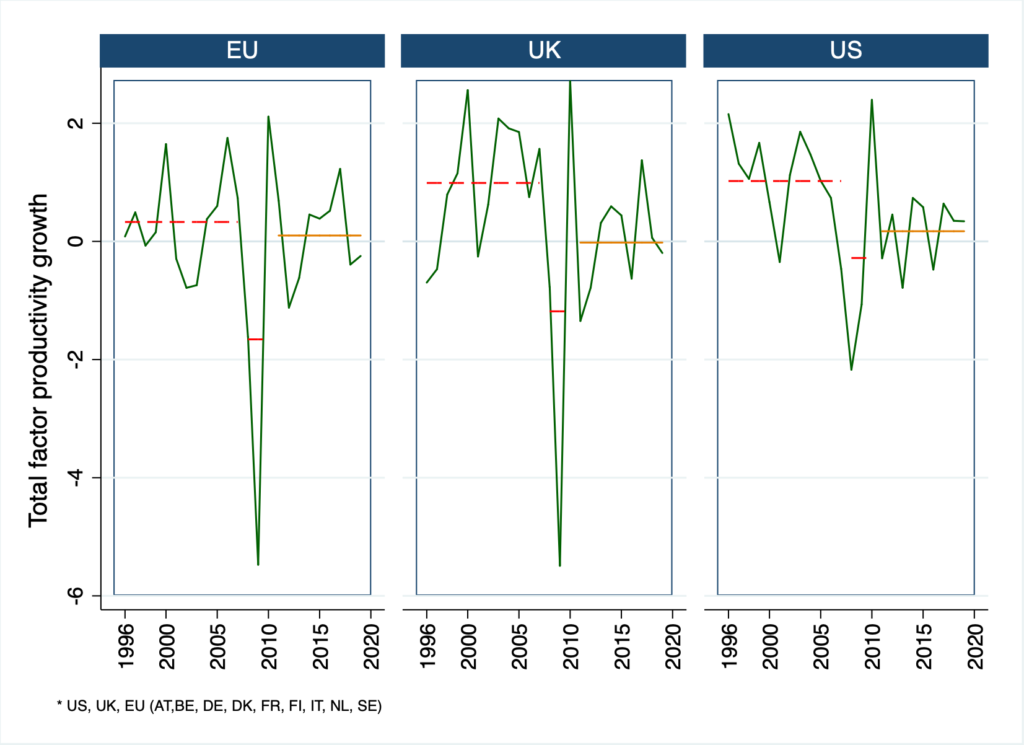
The first panel reports rates of growth in labour productivity – i.e., changes in real gross value added per hour worked – and the second panel shows rates of growth in total factor productivity (TFP) – real value added growth after also accounting for contributions from changes in the education/skill composition of workforces and the degree to which they are equipped with capital, both tangible and intangible – for the market sector in the EU, UK and US. The horizontal lines represent average values before (1995-2007), during (2008-10) and after (2011-20) the global financial crisis. The productivity estimates for the EU reflect a sample of European countries (AT, BE, DE, DK, FR, FI, IT, NL, SE).
Labour productivity growth in the EU sample dropped during the global financial crisis but has bounced back, averaging a tad below pre-crisis rates. The UK also saw a significant dip in labour productivity during the financial crisis but has failed to recover since then. The US shows a similar pattern on average, although its rates of labour productivity growth exceed European countries throughout the periods shown. Furthermore, and unlike the UK, the annual pattern of labour productivity growth in the US after the financial crisis displays a striking positive trend, suggesting an approach to pre-crisis rates.
Total factor productivity in the EU posted low pre-crisis rates of growth compared with the UK and US. Reflecting the sharp slowdown in TFP growth in both these countries after the global financial crisis, this gap seems to have disappeared.
When using this charts please quote:
Bontadini F., Corrado C., Haskel J., Iommi M., Jona-Lasinio C. (2023), EUKLEMS & INTANProd: industry productivity accounts with intangibles - Sources of growth and productivity trends: methods and main measurement challenges
