
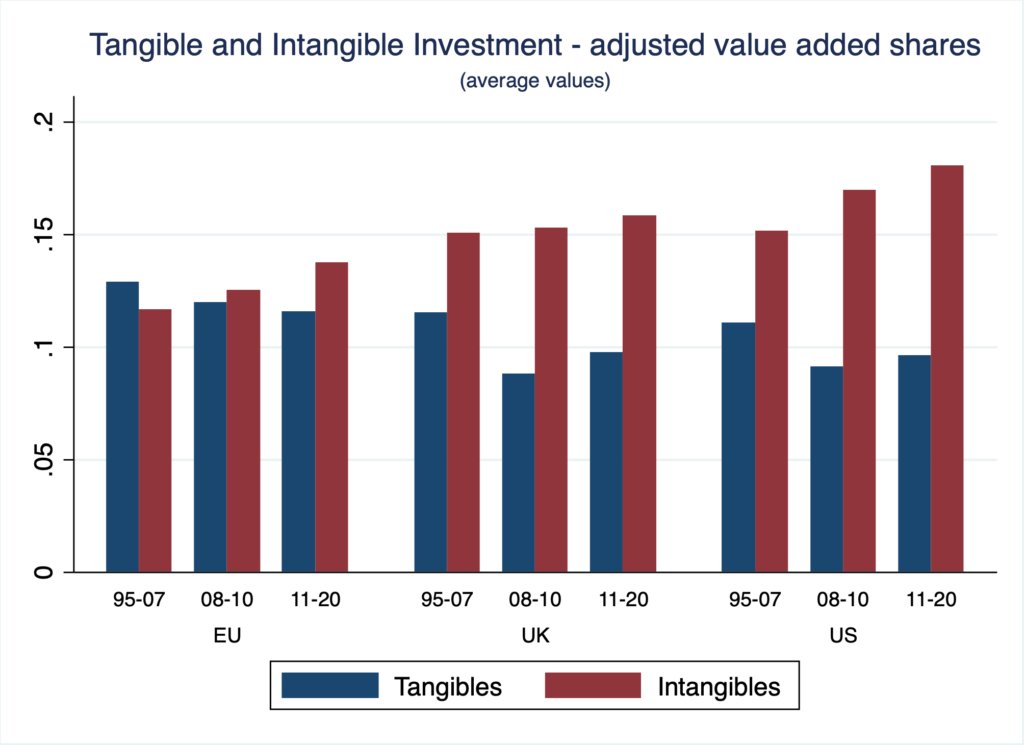
The figure reports investment at current prices in tangible and intangible assets as a share of value added adjusted for non-national accounts intangible assets. Data refer to an aggregate of nine EU countries (AT, BE, DE, DK, FR, FI, IT, NL, SE), UK and US as averaged values before (1995-2007), during (2008-10) and after (2011-20) the financial crisis.
Intangible assets show a growing trend across three countries, despite some remarkable differences. The US sets itself apart as a leader in investment in intangible ranking first both in terms of level of investment and growth rate. The UK comes in second, although we observe a slowing down in the intangible investment after the global financial crisis.
Europe follows yet a different pattern, with a growing trend in investment in intangible assets, although at lower levels than the UK and US and higher and more resilient share of investment in tangible assets.
When using this charts please quote:
Bontadini F., Corrado C., Haskel J., Iommi M., Jona-Lasinio C. (2023), EUKLEMS & INTANProd: industry productivity accounts with intangibles - Sources of growth and productivity trends: methods and main measurement challenges
